Everybody is in Cell Therapy Now
A put together a Cell Therapy Commitment Map to showcase the breadth and depth of development in this space. Plus, some quick takes on the AbbVie-Immunogen Deal (at the end)!


Intro to the Cell Therapy Commitment Map
As we head into ASH next week, I was reflecting on how far the field of cell therapy has come. There have been very interesting advancements and applications of next-generation cell therapy approaches leveraging novel advances in gene-editing, protein design, and cell rejuvenation. Moreover, there have been multiple new companies spun up around these novel advancements and expansion of this therapeutic class into once untouched areas (e.g. autoimmune). Still, new companies are forming around even more advanced ideas, looking to crack into commercial markets and improve upon the handful or so of cell therapy programs currently approved.
However, perhaps the best indicator of how far the field has come is how deeply invested some of the biggest players in our sector have been in this space. What was once a field of a couple handfuls of ambitious startups is now broadly represented by the biggest and most entrenched BioPharma companies. In short, everybody is in cell therapy now.
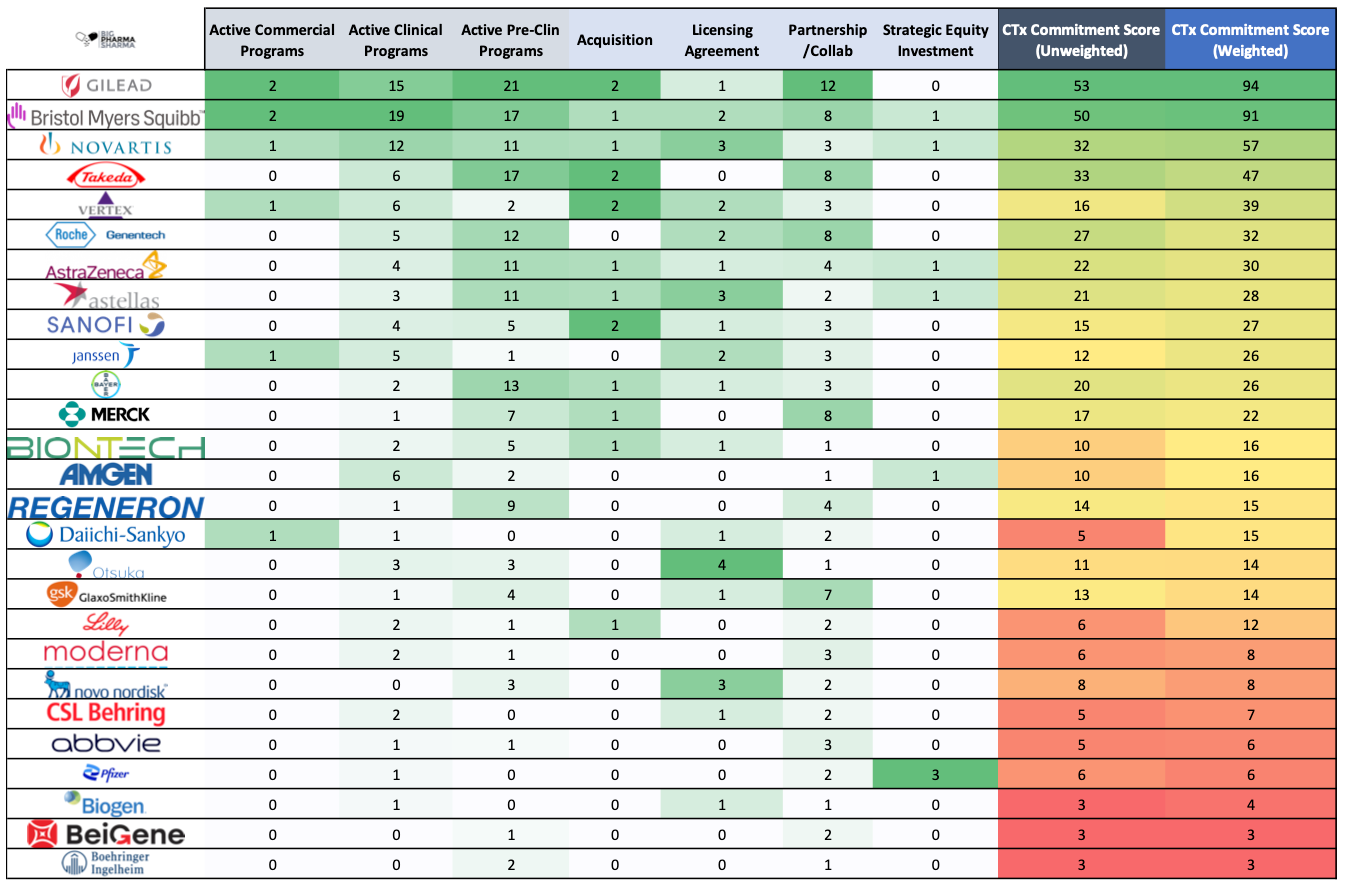
To illustrate this, I built out a “Cell Therapy Commitment Map” of sorts showcasing the top companies in our sector ($20B+ market cap) and summarizing their commitment level in cell therapy with a composite score I developed. You can see the full image of the map below and my commentary, insights, and implications stemming from the map beneath that. But first let’s get oriented!
To get to this composite score the chart first captures several different statistics:
Active programs: commercial, clinical, and pre-clinical
Business Development Activity: Acquisitions, licensing agreements, partnerships/collaborations, and strategic equity investments
In the chart you can see both weighted and unweighted versions of the Cell Therapy Commitment Score (labeled “CTx Commitment Score” weighted and unweighted in the last 4 columns). The unweighted score is simply the raw number of programs/deals in each category summed together providing you with a sense of how active that company has been in cell therapy. The weighted score, I believe, provides a slightly more accurate picture of Cell Tx Commitment across the comparative set, by attributing more “points” to activity that signal deeper commitment levels. For example, companies with commercialized cell therapy products are clearly committed to cell therapy being a core part of the company’s strategy, while a company that simply makes an equity investment in a cell therapy company could be interested in the space from a growth standpoint, but much more easily exit that investment if the winds turn and strategic priorities change.
For reference, I’ve weighted the various attributes as such:
Active Programs:
Commercial: 10 point
Clinical: 2 points
Pre-clin: 1 point
Business Development Activity:
Acquisitions: 5 points
Licensing Agreements: 1 point
Partnerships/Collaborations: 1 point
Strategic Equity Investment: 0.5 points
Obviously, these are somewhat subjective, but I feel like this scoring at least directionally gets at the various levels of investment from large companies.
Caveats
A couple caveats before we get into map. “Cell Therapy” can mean different things to different people. Some people hear “cell therapy” and just think of CAR-Ts for oncology. Others hear the phrase and think of regenerative medicine. For this exercise I pulled data from Hanson Wade’s Beacon Adoptive Cell Therapy database and largely went by their classifications of cell therapy programs and deals. “Cell Therapy” for the purposes of this map does include adoptive cell therapies (ACTs) like TILS, CAR-T, TCR-T, CAR-NK, etc. as well as things like stem-cell based therapies for rare diseases, Type 1 diabetes, neurology, and other indications. For this exercise I wanted to be a bit more comprehensive, but at a high level if you simply zeroed in on just ACTs, the directional insights from this map would not change too significantly.
Regarding BD&L activities, there were a few types I excluded for simplicity. The broadest categories of items I excluded were Contract/Services agreements (e.g. someone signing with a CDMO to manufacture their product), Debt financings, and venture investments. Venture investments specifically were a little tough to collate with how the Beacon’s database is set up and are wrought with redundancy as the same investors are typically investing in the same company for multiple rounds. Again, I think these exclusions don’t really impact the message the map is trying to convey. Also, the “commitment level” of a venture investment maid by a LargeCo would likely score low (if not zero) on my weighted scoring.
With that out of the way, let’s get into the map!
Cell Therapy Commitment Map: Key Insights